- {x}
- Substring With Largest Variance
- Find Resultant Array After Removing Anagrams
- Maximum Consecutive Floors Without Special Floors
- Largest Combination With Bitwise AND Greater Than Zero
- Count Integers in Intervals
- Closest Node to Path in Tree
- Percentage of Letter in String
- Maximum Bags With Full Capacity of Rocks
- Minimum Lines to Represent a Line Chart
- Sum of Total Strength of Wizards
- Number of People That Can Be Seen in a Grid
- Check if Number Has Equal Digit Count and Digit Value
- Sender With Largest Word Count
- Maximum Total Importance of Roads
- Booking Concert Tickets in Groups
- Rearrange Characters to Make Target String
- Apply Discount to Prices
- Read More...

Minimum Lines to Represent a Line Chart
You are given a 2D integer array stockPrices where stockPrices[i] = [dayi, pricei] indicates the price of the stock on day dayi is pricei. A line chart is created from the array by plotting the points on an XY plane with the X-axis representing the day and the Y-axis representing the price and connecting adjacent points. One such example is shown below:

Return the minimum number of lines needed to represent the line chart.
Example 1:

Input: stockPrices = [[1,7],[2,6],[3,5],[4,4],[5,4],[6,3],[7,2],[8,1]]
Output: 3
Explanation:
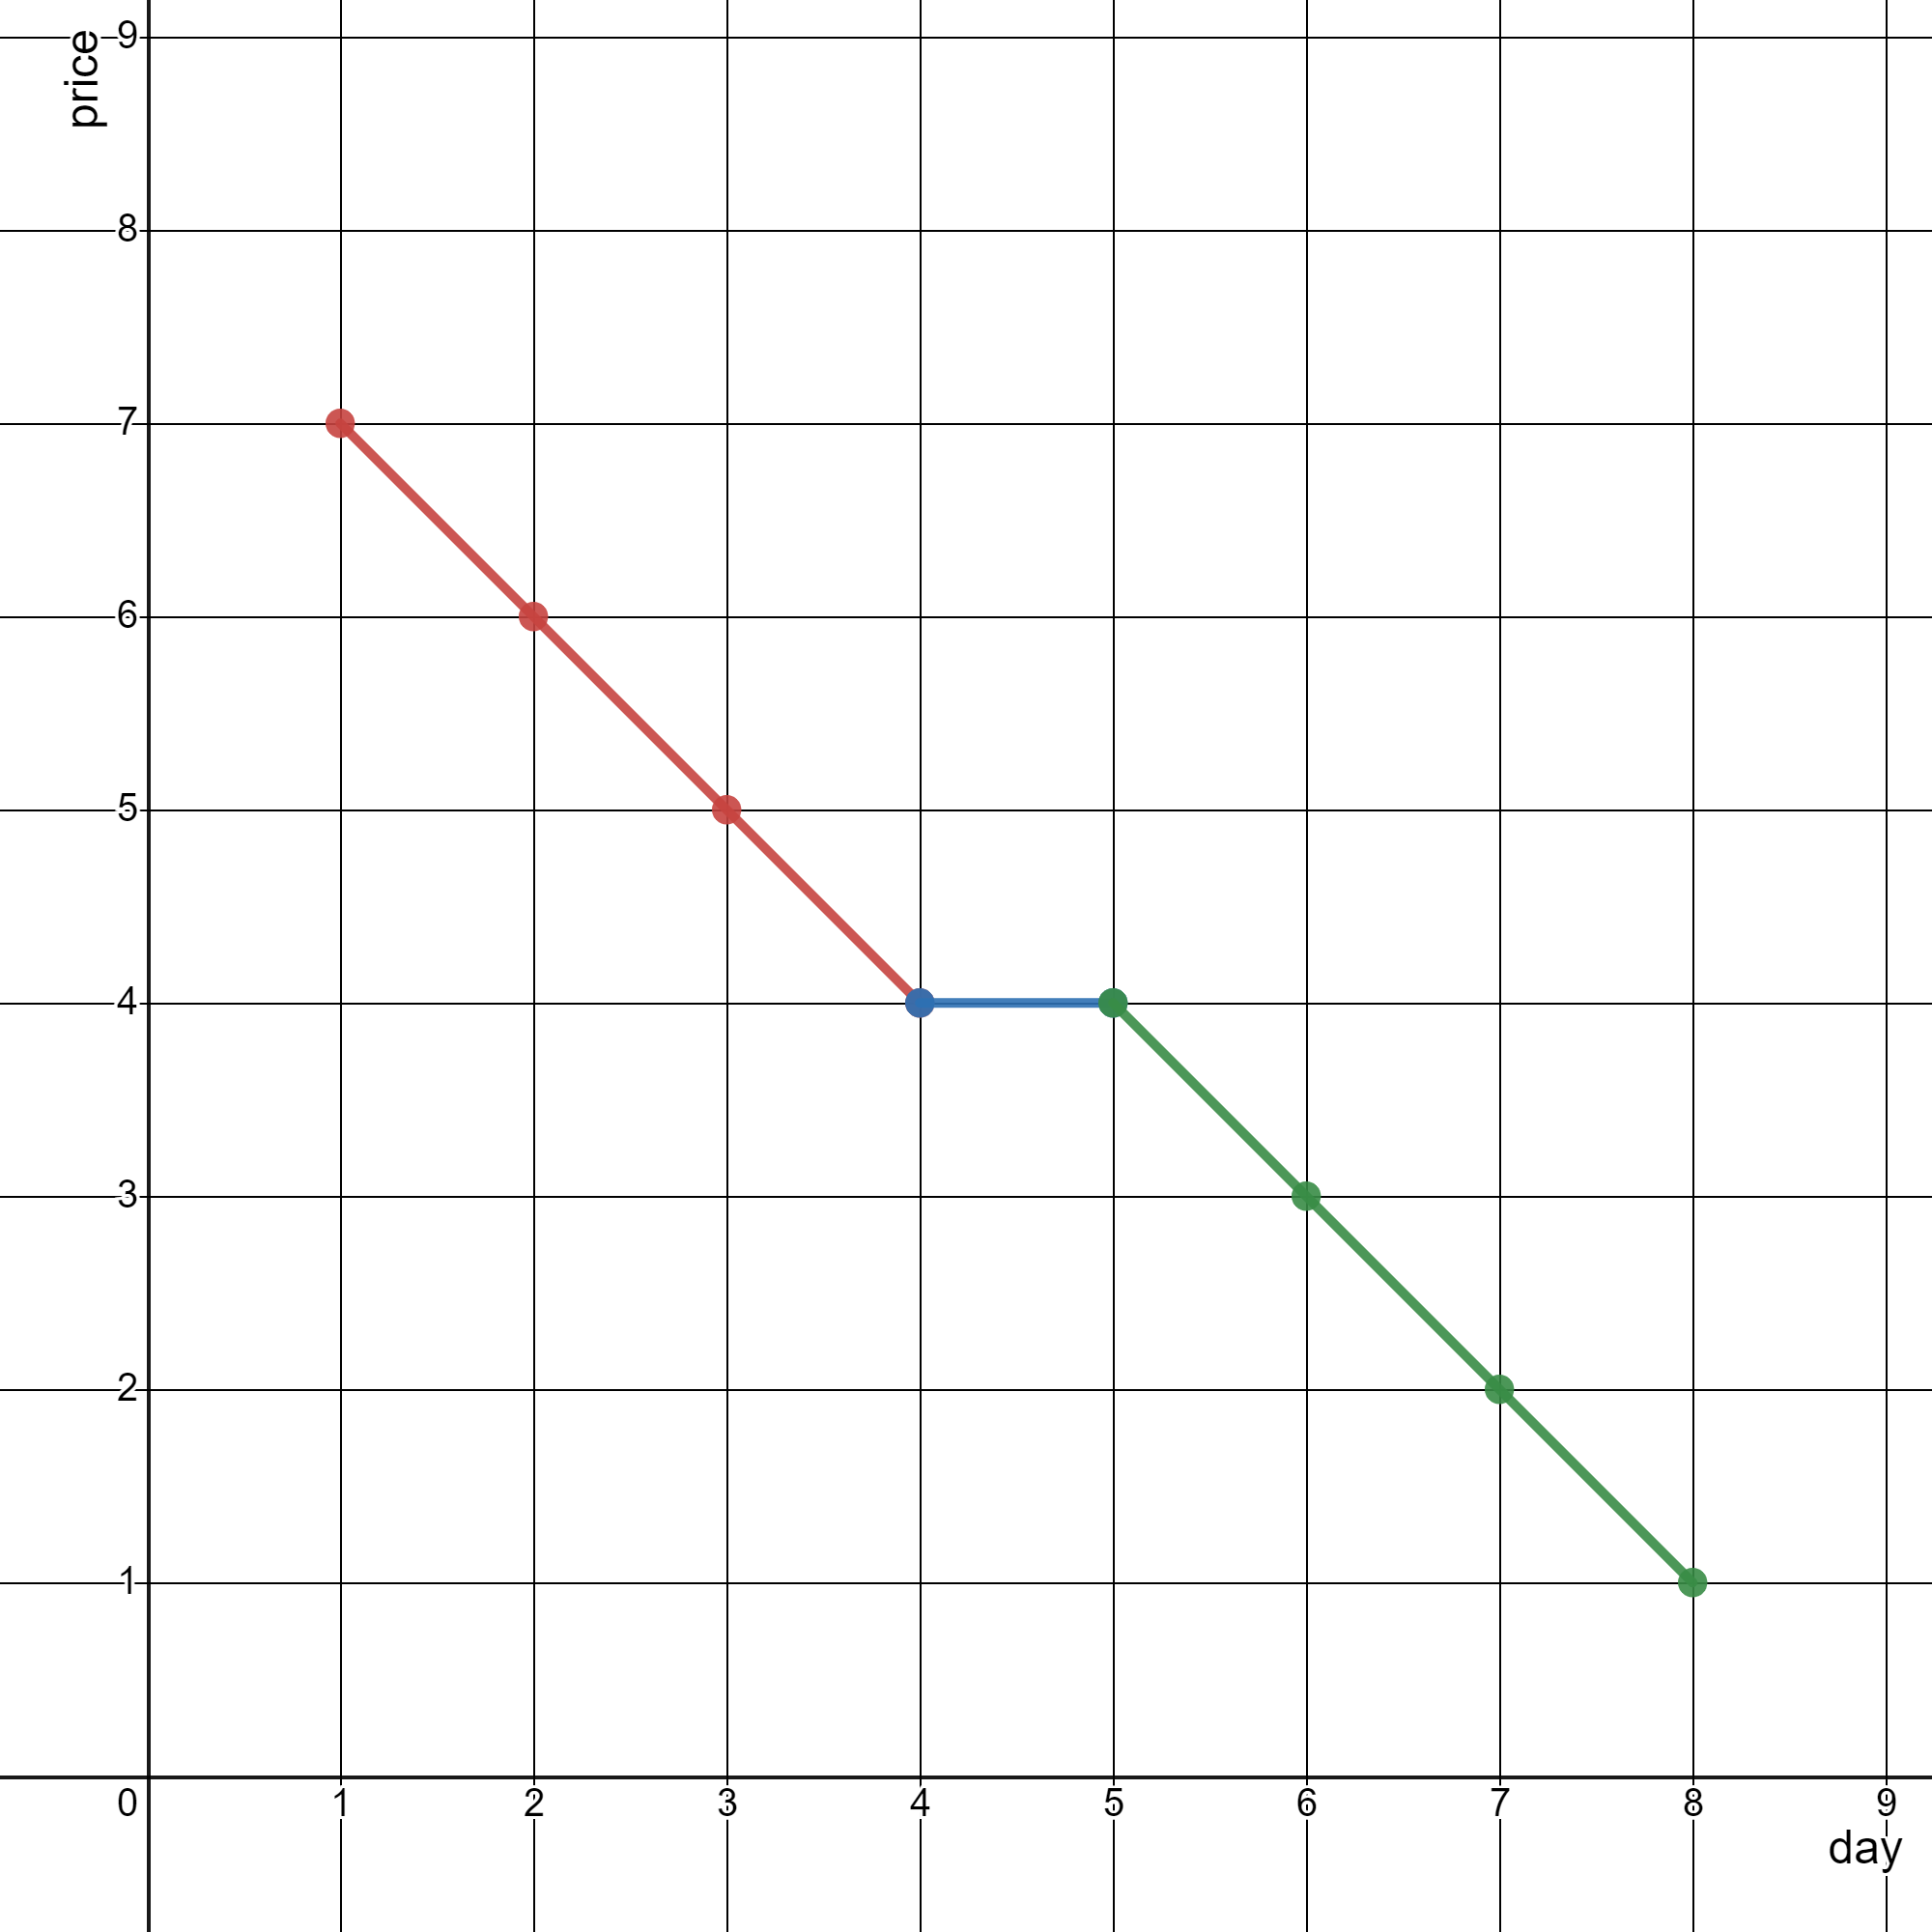
The diagram above represents the input, with the X-axis representing the day and Y-axis representing the price.
The following 3 lines can be drawn to represent the line chart:
- Line 1 (in red) from (1,7) to (4,4) passing through (1,7), (2,6), (3,5), and (4,4).
- Line 2 (in blue) from (4,4) to (5,4).
- Line 3 (in green) from (5,4) to (8,1) passing through (5,4), (6,3), (7,2), and (8,1).
It can be shown that it is not possible to represent the line chart using less than 3 lines.
Example 2:

Input: stockPrices = [[3,4],[1,2],[7,8],[2,3]]
Output: 1
Explanation:
As shown in the diagram above, the line chart can be represented with a single line.
Constraints:
1 <= stockPrices.length <= 105stockPrices[i].length == 21 <= dayi, pricei <= 109- All
dayiare distinct.
Solution Explanation
This problem asks for the minimum number of lines needed to represent a line chart given a set of stock prices. Each point (day, price) represents a point on the chart, and adjacent points are connected. The goal is to find the minimum number of lines that can represent all the connected segments.
Approach:
The key observation is that consecutive points lie on the same line if they have the same slope. We can calculate the slope between consecutive points after sorting the points by day. If the slope changes, it means a new line is needed.
-
Sort: Sort the
stockPricesarray by theday(x-coordinate). This ensures that we process consecutive points correctly when calculating slopes. -
Calculate Slopes: Iterate through the sorted array, calculating the slope between consecutive points. The slope between points
(x1, y1)and(x2, y2)is(y2 - y1) / (x2 - x1). To avoid floating-point comparisons (which can be imprecise), we check if(y2 - y1) * (x3 - x2) == (y3 - y2) * (x2 - x1)for three consecutive points(x1, y1),(x2, y2),(x3, y3). This condition checks if the slopes are equal. -
Count Lines: Increment a counter whenever the slope changes, indicating a new line is needed. The initial slope is considered as a line starting at the first point.
Time Complexity Analysis:
- Sorting the array takes O(n log n) time, where n is the number of stock prices.
- Iterating through the sorted array to calculate slopes and count lines takes O(n) time.
- Therefore, the overall time complexity is dominated by the sorting step, resulting in O(n log n).
Space Complexity Analysis:
The space complexity is dominated by the sorting algorithm used (which can vary depending on implementation). In-place sorting algorithms like quicksort or mergesort have a space complexity of O(log n) in the average case, while heapsort has O(1) space complexity. In the worst case, some sorting algorithms might require O(n) extra space. However, for the purposes of this analysis, we will consider the space complexity to be O(log n) on average, or O(1) for heapsort.
Code Examples (with explanations):
The provided code snippets in Python, Java, C++, Go, and TypeScript all follow the same algorithm. Here's a breakdown of a Python solution (with slight modification for clarity):
from itertools import pairwise
def minimumLines(stockPrices: list[list[int]]) -> int:
"""
Calculates the minimum number of lines to represent a line chart.
Args:
stockPrices: A list of lists, where each inner list represents a stock price [day, price].
Returns:
The minimum number of lines needed.
"""
stockPrices.sort() # Sort by day
lines = 0 # Initialize line count
# Handle the first pair manually to avoid index error
if len(stockPrices) > 1:
x1, y1 = stockPrices[0]
x2, y2 = stockPrices[1]
dx, dy = x2-x1, y2-y1
lines = 1
# Iterate through pairs of consecutive points
for (x1, y1), (x2, y2) in pairwise(stockPrices[1:]): #start from second pair, since we already handled first in the if statement
dx1, dy1 = x2 - x1, y2 - y1
# Check if the slope has changed; handle the case where dx ==0 and dx1 == 0 to avoid ZeroDivisionError
if (dx * dy1 != dy * dx1) :
lines += 1
dx, dy = dx1, dy1
return lines
The code iterates through consecutive pairs using itertools.pairwise. The core logic is in the if condition checking for slope changes. If the slopes differ, a new line is needed and the counter is incremented. The function efficiently determines the minimum number of lines based on slope changes. The use of pairwise makes the code concise and readable. The handling of the edge case of the first pair enhances robustness.